
Generate label footprints for Satellite Imagery: the Pythonic Way [Part 1]
Published:
I got introduced to super dope fields of Geographic Information Systems, Spatial Analysis and Satellite Imaging while I interened at Planet in San Francisco. This series of posts will introduce you to a side project that I accomplished. Special thanks to Kat and Kyle, my mentors at Planet. Disclamer: Credits will be given where they are due. I will assume that you might know certain concepts and tools at the start of each part of this tutorial. In case you do not know them, don't worry you can always look them up and come back to the tutorial afterwards. But, between you and me; do come back! In any case I will mention the things to know at the start of each part of this series. Like this:
Things to know or to brush up
- json and geoJSON file formats
- Skim over Open Street Maps (OSM) documentation. Here and here.
- Skim over OSM's web API: Overpass API and overpass-turbo to build queries interactively.
Introduction
Suppose you have satellite imagery for an Area of Interest (AOI). You can do all sorts of crazy things with that in the computer visio and machine learning community. But given just a geoJSON file of an AOI, how can you get the footprints of all the buildings in the Le Plateau area of Montreal or all the roads/alleys in the South of Market (SoMA) district in San Francisco or perhaps you want to see where are all the general amentities in the Italian quarter in Boston. Once, you have got the footprints as a geoJSON file, can you save them as images (tif, png or anything you like). And, finally you know what you can do with these images? Yes, you guessed it right. Analyse the hell out of it.
Let us first see some pretty images.


Let's say we have the four coordinates (we will see how to get those in this tutorial) of some region on earth. We call the region as our AOI. Below is a list of tasks that we would like to accomplish with this AOI...
Tasks
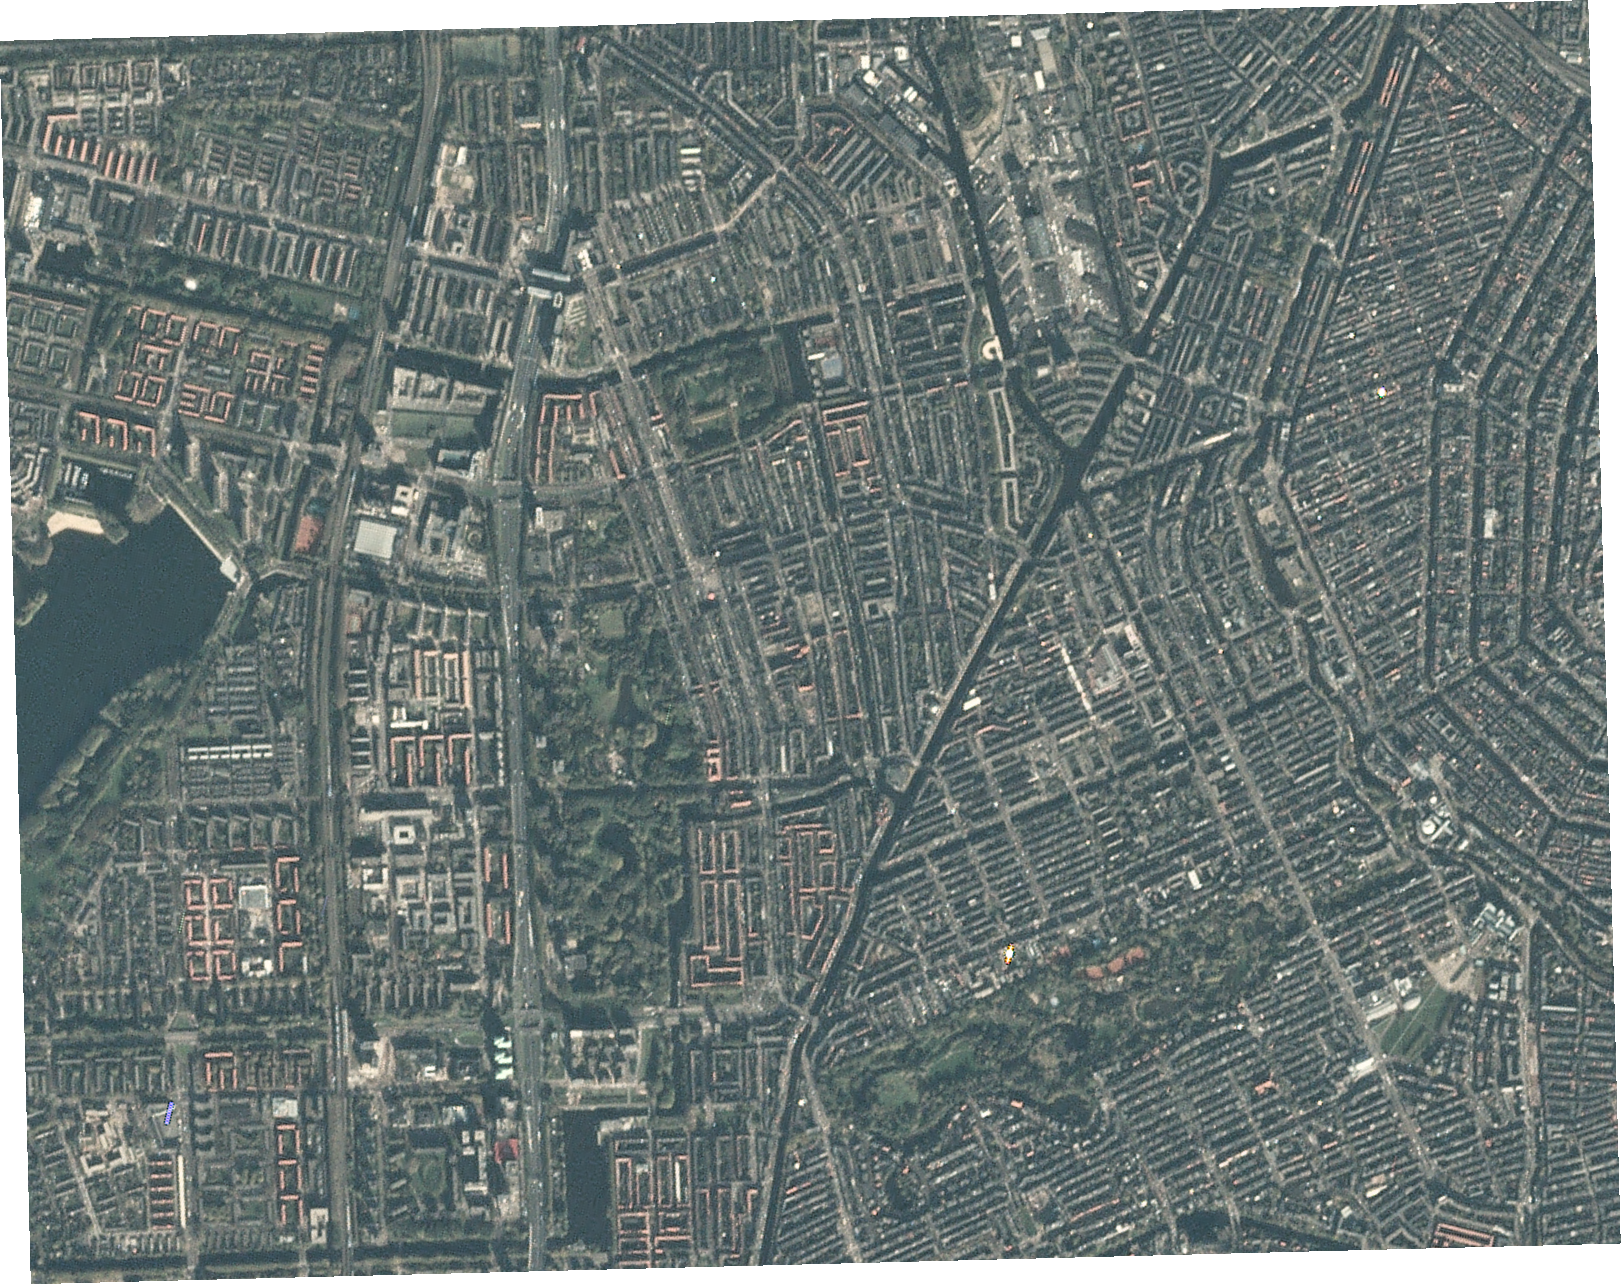
- Get the orginal image of the AOI. Figure 1 is an example of this.
- Get the footprint of all the amenities you are looking for (here, highways/roads). The footprint means the coordintes of each of the building, road, park, waterbody etc. in our original AOI. geoJSON file will handle that.
- Then you want save this save an image. Figures 2 and 3 shows the roads and the buildings.
- You also want to overlay this on top of a map (Google Maps, perhaps?). This will be accomplished using the awesome Python visualisation library aka Bokeh.
In this first part of the tutorial series, we will first extract the AOI of some desired region and save that as a geoJSON file. Next, we will repeat this small exercise on Open Street Maps' web API but this time we will also query buildings (or highways) and save the entire footprint as a geoJSON. We will stop and ponder over the saved geoJSON files. We can save the footprints as images or html files.
Select an AOI and save that as geoJSON
Let's explore geojson.io. You have the choice to select an AOI using the cursor. Go to your favorite city and draw an AOI. You can do that either select a rectangular region or an arbitrary polygon. Let's draw a rectangular region for now. I have drawn one in Montreal (the city I am currently writing this post from). Next, on the right side you can see the JSON tab. By clicking that you can see the coordinates of the given region. Remember that each coordinate is in the form: (longitude, latitude). On the left panel we have the option to save these coordinates in various forms. For now, we will save it as geoJSON. Here (on gitHub) is the geoJSON file that I got for roughly Montreal's Lower Plateau area. I have also included a screenshot below to make sure we have the right thing with us. Fun fact: I love the café culture in this city!
{"type":"FeatureCollection","features":[{"type":"Feature","properties":{},"geometry":{"type":"Polygon",
"coordinates":[[
[-73.58076095581055,45.509474756808736],
[-73.55835914611816,45.509474756808736],
[-73.55835914611816,45.52081177681294],
[-73.58076095581055,45.52081177681294],
[-73.58076095581055,45.509474756808736]
]]}}]}}

Build a query on OSM's web API
OSM's web API is known as Overpass API and with overpass-turbo you can run Overpass API's queries interactively on the web. Just as we did before, go ahead and select a region of interest at overpass-turbo. This time I am going with a small part of the financial disctrict in San Francisco. On the menu bar at the top of the website, you should see an interesting option named: Wizard. Click on that and feel free to explore in your free time. For now, type in building in the query box and then click on the build and run option. You should see some code generated on the left side of your screen and it appears like this. Make sure you have got the same thing.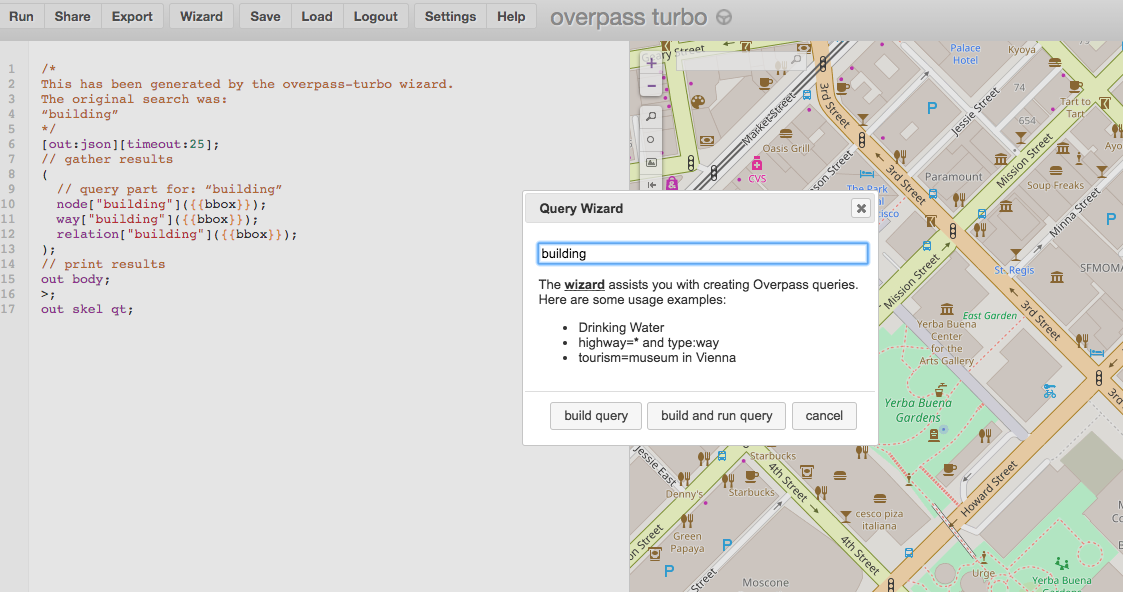
/*
This has been generated by the overpass-turbo wizard.
The original search was:
“building”
*/
[out:json][timeout:25];
// gather results
(
  // query part for: “building”
  node["building"]();
  way["building"]();
  relation["building"]();
);
// print results
out body;
>;
out skel qt;
What you have got is a code snippet which runs on the server and queries all the buildings in the given AOI. You can see that on the maps. The footprint of each of the building is shown as bounding boxes. Go ahead and zoom in to see the different buildings. Did you get something like this?

And now you are probably wondering can I save this data? Ofcourse, we can! And we will do that in three different ways.
1. Let us get a geoJSON file just like we did before. To do that click on export and then save the file as a geoJSON. If you go through the file, you should see that there is tons of information out there. Let us see: You get the coordinates of each building. Wow. What is more interesing is the additional information that you get out of it. Here is my file (an on gitHub). And the first few lines of the file....
  {
  "type": "FeatureCollection",
  "generator": "overpass-ide",
  "copyright": "The data included in this document is from www.openstreetmap.org. The data is made available under ODbL.",
  "timestamp": "2018-02-25T06:10:02Z",
  "features": [
    {
        "type": "Feature",
      "properties": {
        "@id": "relation/6483285",
        "addr:city": "San Francisco",
        "addr:housenumber": "55",
        "addr:postcode": "94103",
        "addr:state": "CA",
        "addr:street": "4th Street",
        "building": "hotel",
        "building:levels": "5",
        "height": "133",
        "name": "San Francisco Marriott Marquis",
        "operator": "Marriott",
        "phone": "(415) 896-1600",
        "smoking": "no",
        "tourism": "hotel",
        "type": "multipolygon",
        "website": "https://www.marriott.com/hotels/travel/sfodt-san-francisco-marriott-marquis/",
        "wikidata": "Q3471438"
      },
      "geometry": {
        "type": "Polygon",
        "coordinates": [
          [
            [
              -122.4049189,
              37.7858309
            ],
            [
              -122.404879,
              37.785861
            ],
            [
              -122.4047012,
              37.7857217
            ],
            [
              -122.4046577,
              37.7856871
            ],
            [
              -122.4046488,
              37.7856801
            ],
            [

              -122.4042572,
              37.7847125
            ],
            [
              -122.4042282,
              37.7847348
            ]
          ]
        ]
      },
      "id": "relation/6483285"
2. Save this AOI as an image. Click on export and then select the save as png file option.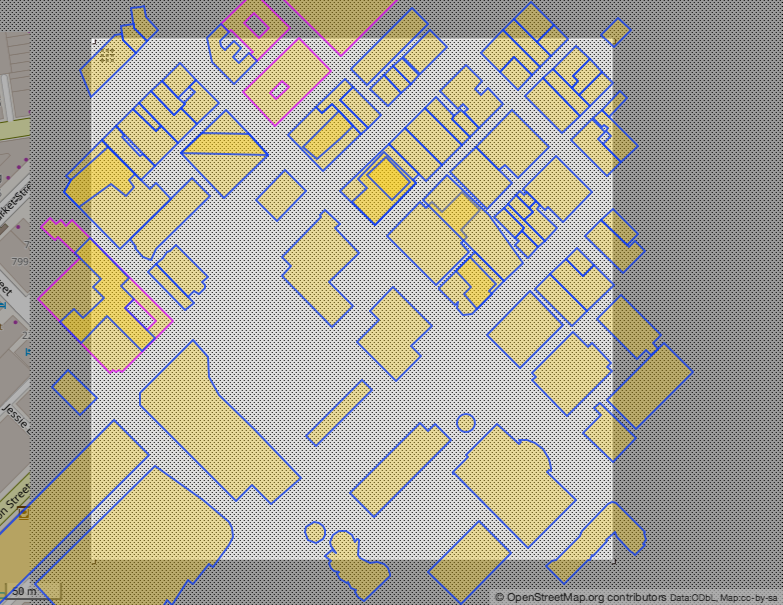
3. You can also open this on a map and get a weblink which you play with. Here is my link.
We will stop with that in this tutorial. In the next part of this series, we wil dive into the code and actually get to the meat of the problem! Go here for part two of this tutorial.